 office (412)
967-9367
office (412)
967-9367INFLATION EXPECTATIONS (Bernanke, Krugman, Fisher
Inflation Fears from QE3)?
|
Since QE3, critics within and outside of the Feds
have been calling for inflation expectations to
rise. For example, within the federal Reserve
Bank of Dallas President Richard Fisher said the
central bank's third round of bond purchases would
probably fail to create jobs while risking higher
inflation. Nobel prize winning economist Krugman on the
other hand argues Bernanke should be doing more by
raising the Fed's inflation target from around 2% to
3-4% for the next 5-years
to spur job creation and growth. How can you figure out who is right and who is wrong? The best source of information is to check out the US Treasury Yield Curve. This curve embodies market expectations and is arguably the best source of information avaibale. In the following chart we back out inflation expectations from the Nominal and Real Rate US Treasury Yield Curves. These graphs provide the current implied expected inflation rate by time to maturity. These graphs move forward with time and so for your interest we also graph the actual results around QE3. |
Terminology used in this graph is defined after the graph.
How do I read off the inflation expectation numbers from the graph?
Just hold the cursor over any one of the plotted circle points on any of the graphs. You can resize your browser if the circle dots are too small.
What happened to Inflation Expectations around QE3?
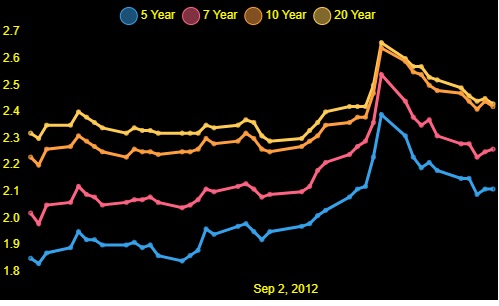
From the above chart you can see there was an immediate sharp increase which then started to fall away.