 office (412)
967-9367
office (412)
967-93673.4 Pricing Relative to the Yield Curve
|
O |
nce the market determines the price of different fixed-income securities, a shape for the yield curve results. In this topic, we will first work with a simple horizontal yield curve shape. In a horizontal (or "flat") yield curve, the spot interest rates are independent of a security’s time to maturity.
We use an example to explore the relationship between a constant yield curve and the yield to maturity.
Example: Valuing a Coupon Bond Relative to the Yield Curve
Suppose a coupon bond with 12 months remaining to maturity has a face value of $1,000 and a coupon rate of 7% per year, paid monthly. The bondholder receives $5.83 every month for 12 months and $1,000 at the end.
Now suppose that the yield curve is flat over the first 12 months. That is, the spot interest rate computed from a zero-coupon bond is 12% per year compounded monthly for maturities of 1, 2 , 3 ...,12 months. Because the compounding period is monthly, the appropriate interest rate to apply is 1% per month.
To price this bond relative to the observed yield curve, you first identify the sequence of cash flows ($5.83 per month plus $1,000 in twelve months time). The present value of this sequence is then computed by applying the appropriate spot interest rate that is extracted from the yield curve (1% per month). As a result, the present value is:
![]()
Suppose that the term structure now takes a parallel shift to the left. That is, it remains flat but at 10% instead of 12%. The value of the bond increases, because interest rates have fallen.
You can verify that the one-month spot rate is now 5/6% per month, and the value of the bond rises to $971.56:
![]()
If the yield curve is horizontal, computing the yield to maturity from the price of any fixed-income security is straightforward; it must equal the constant spot interest rate.
As a result, when the price of the bond in the above example equals $953.10, then the yield to maturity is 12%. When the price is $971.56, the yield falls to 10%.
In general, the yield curve is not horizontal. Instead, spot rates vary with maturity. This makes calculating the value of a bond ("pricing from the yield curve") and computing the yield to maturity more difficult.
Another complication is that the term "yield curve" is not always used in the same way. Sometimes, it is used to describe yields to maturity, which, as you have seen, may be quite different from spot interest rates.
In this text, unless we specifically say otherwise, we always assume that the yield curve refers to the "spot yield curve" (i.e., the yield curve determined from the prices of zero-coupon bonds).
Nonhorizontal Yield Curves
Observed yield curves are almost never horizontal. The yield curve throughout this century has been upward sloping, where longer-maturity spot rates are higher than shorter-maturity spot rates. This is the case in the following example.
Assume the following three year term structure of interest rates:
|
Maturity |
1+ Spot Rate |
|
1 Year |
1.0400 |
|
2 Year |
1.0696 |
|
3 Year |
1.0989 |
You can use this yield curve to determine the price of four types of bonds:
1. One year zero-coupon bond (face value = $100)
2. Two year zero-coupon bond (face value = $100)
3. Three year zero-coupon bond (face value = $100)
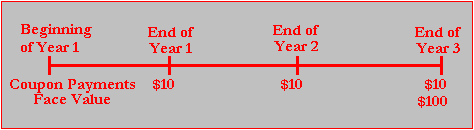
4. Three year coupon bond (10% coupon rate compounded annually and face value =
100)
Timelines that describe the timing of the cash flows for each security type are presented in Figures 3.2-3.5:
Figure 3.2 Timeline for the Zero-Coupon Bond Contract (1)
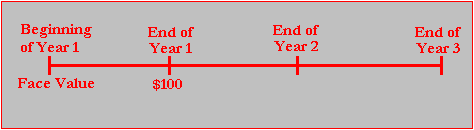
Figure 3.3 Timeline for the Zero-Coupon Bond Contract (2)
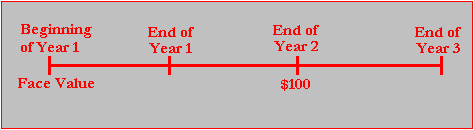
Figure 3.4 Timeline for the Zero Coupon Bond Contract (3)
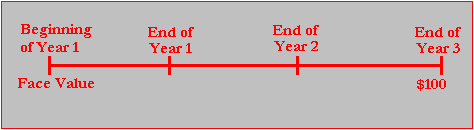
Figure 3.5 Time Line for the Coupon Bond Contract (4)
By using the term structure of spot interest rates, each zero-coupon bond and the coupon bond can be valued at the beginning of Year 1 given the term structure. The valuation approach is an application of the formula for the three year coupon bond:
The zero-coupon bond valuation is merely a special case with C = 0 and the time period for F set to 1, 2, and 3 respectively.
The spot interest rates are 4%, 6.96%, and 9.89%, respectively, and thus the value of each security relative to the assumed term structure is determined as follows:
1. One year zero ($100/1.04) $96.15
2. Two year zero ($100/(1.0696)
2 $87.413. Three year zero ($100/(1.0989)
3 $75.364. Coupon bond [($10/1.04)+($10/1.0696
2)+[$110/1.09893] = $101.25