5.2 T-Bill Futures
|
G |
iven the enormous size of the market for Treasury securities (T-bills, T-notes and T-bonds) it should not come as a surprise that there is an active market for interest rate futures. While the largest interest rate futures markets is the 3 month Eurodollar future, the futures contract on the 3 month T-bill is also a very actively traded contract. (Eurodollars are deposits of U.S. dollars held by major banks outside of the U.S.)
A T-bill future is traded on the International Monetary Market (IMM) in Chicago. This market requires the physical delivery of the underlying T-bill. Physical delivery means that at the delivery date, the short (seller of the contract) must give the long the T-bill. This is in contrast to cash settlement, where the short simply pays the long the cash value of the underlying instrument.
What is delivered is a T-bill with 3 months to maturity and a million dollar face value. You may recall from Chapter 4 that the Treasury auctions 3 month T-bills, 6 month T-bills, and 1 year T-bills. These bills are auctioned at regular intervals, and the delivery dates of the futures contracts are set so that on a delivery date, there are three possible underlying bonds: the new 3 month T-bill, the "seasoned" 6 month T-bill, and the "seasoned" 1 year T-bill. The seasoned 6 month bill is that which was issued three months ago and has three months left to maturity. The seasoned one year bill was issued nine months ago and also has three months left. Three months can mean 90, 91, or 92 days, depending on the month in which the contract was issued.
Besides defining the underlying bond, part of the standardization of T-bill futures is that settlement occurs only in March, June, September, and December. These dates set up a cycle of traded contracts. For example, in March, three T-bill futures contracts that are trading are those for delivery in June (of a currently 6 month T-bill), September (of a T-bill which currently has nine months to maturity), and December (of the T-bill with one year to maturity). With each of these contracts, the underlying bond is also traded. However, you can trade futures with delivery dates even up to two years in the future. For the longer maturity dates, the underlying bond does not trade when the futures contract does.
Quotations for Treasury Bill Futures
Similar to T-billstb_ts, T-bill Futures prices are quoted relative to an index value. This time, however, they are quoted at 100 minus an annualized percentage discount rate. The annualized discount rate is expressed to two decimal places. Even though it looks like a price, what is quoted is not the price. The actual price is computed from the quotation as follows:
![]()
Thus the quoted price, QP, is an annualized discount yield for a future that requires the delivery of a 3 month T-bill with a face value of $1,000,000. Since it is quoted to two decimal places, the smallest price change (or "tick") is one basis point, 0.01%.
By using this formula, you can verify that a tick translates into $25 for a 90 day T-bill. This means that if the quoted price changes by one tick, the actual futures price changes by $25. To check this, suppose QP = 0. Then, the price is $750,000. If QP equals one basis point, then the price is:
![]()
The difference is therefore $25.
Interest Rates Implied by Futures Prices
Now that we know how to calculate prices from T-bill futures quotes, we can return to the question of forward interest rates implicit in futures prices.
Implicit in a T-bill futures price is the forward rate of interest for the period of time from the maturity of the future to the maturity of the underlying T-bill. Under the expectations theory of the term structure of interest rates, this forward rate is interpreted as the expected spot rate for a 91 day T-bill that is acquired on the day of settling the futures contract.
Unfortunately, we cannot quickly calculate the implicit interest rate, because the futures price also reflects the effect of marking to market. However, if we either assume that interest rates are known with certainty, or that marking to market does not have a major effect on the futures price, then we can assume that the futures price is also the forward price. Under this assumption, the relationship between spot and forward rates from futures prices can be compared to the spot and forward rates from the current yield curve.
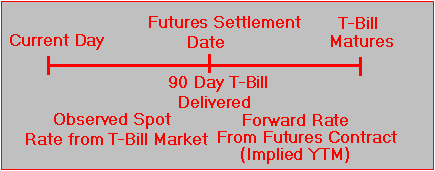
Represented on a timeline, the implied forward rate from a T-bill future is:
Timeline for a T-Bill Future
Figure 5.1

The short end of the yield curve, constructed using the zero-coupon T-bills, also provides an estimate of the implied forward rate for this same period. Under the assumption of constant interest rates using the T-bill future, we can compute the implied yield to maturity (YTM) on the delivered 90 day T-bill in one period’s time.
![]()
If we know the spot rate for a T-bill that has the same life as the T-bill futures contract, then we can also compute the spot yield to maturity that covers the life of the futures contract.
For example, if the futures settlement is one period from now and the delivered T-bill has a one period life, then we compute the geometric average of the current one period spot rate and the one period forward rate from the futures price, YTM. This provides the two period spot implied from futures trading for the delivered T-bill. This two period spot rate is computed as the left hand side of the equation below.
![]()
This can then be compared to the spot rate of interest for the T-bill that is delivered by the futures contract.
In the next topic, T-bill futures example, this theory is applied to actual futures market data.
 office (412)
9679367