 office (412)
9679367
office (412)
96793671.3 BONDS
|
I |
In the fixed-income security markets of the world, prices (or values) are being determined constantly. The largest and most liquid security market in the world is the market for U.S. Treasury securities. In this market, traders around the world trade Treasury obligations to pay cash over many different times -- up to 30 years into the future. In particular, simple Treasury obligations called strips (or zero-coupon bonds) are traded for a wide range of different maturities. These maturities can range from a few days to 30 years. If you buy a Treasury strip, you receive a fixed payment (the face value) at a fixed date in the future (the maturity date). As you will see, zero-coupon bonds such as strips are fundamentally important because they allow us to deduce the values of many other types of fixed-income securities.
A common feature of any fixed-income security is that it can be represented on a timeline. This is a graphing concept illustrated by Figure 1.2. This timeline displays both the timing and the amount of cash flows that the buyer of a fixed-income security will receive.
For example, often a fixed-income security is defined in terms of some face value plus the promised interest rate, or coupon rate, that is paid for the amount of the face value. In this case, the security is called a "coupon bond," and its cash flows are defined by the coupon rate times the face value over time plus the face value at the end of its life.
Example 1.3.1: Coupon Bond Consider a 30-year bond with a face value equal to $10,000. Suppose that it pays simple interest on the face value two times a year (i.e., semiannually) at a coupon interest rate equal to 10% per year. Because interest is paid semiannually, we divide 10% per year by two to express it relative to six months. This means that every six months, the bond pays $500 = $10,000(0.10/2) in interest payments. Finally, at the time of maturity, this bond pays the $10,000 face value in addition to the final interest payment. The cash flows from this security can be represented on a timeline as shown in Figure 1.2.
|
Figure 1.2 Coupon Bond |
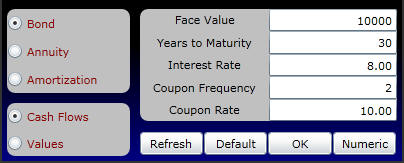
This 30-year example is easily solved using the Time Value of Money subject in Bond Tutor. Suppose the market rate of interest equals 8% per year. Online, you enter this problem as follows:
Graphically, both the present value at the end of every six months and the nominal total dollar value are graphed as follows:
The red chart represents the total cash flows accruing from the current coupon period until the time to maturity. At Coupon Period 1, the cumulative, undiscounted cash flows are $40,000; at Coupon Period 2, these cash flows are $39,500 and so on.
Coupon Period 1 is 60 times $500, plus $10,000. This equals $40,000. Online, the remaining undiscounted and present values are provided by clicking on the Numeric button at the bottom of the Bond Tutor screen.
You should click on Numeric in the above live screen and the popup grid with undiscounted and discounted values will appear.
The bottom bar chart (yellow in default colors) graphs the present value at each coupon period. This value declines from above the face value. The reason for this is that the promised or coupon rate is greater than the market's required rate of return. Therefore, the market will bid the price up above the face value, which is equivalent to lowering the expected return from the bond.
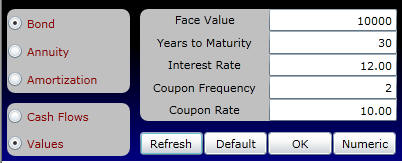
Example 1.3.2: Increasing the interest rate Now consider this same example using a market rate of interest equal to 12% per year. The market rate of interest exceeds the coupon rate for the bond. This implies that investors want a higher return than is provided by coupon payments alone. As a result, the market will let the price fall below the face value, to increase the return from this issue.
Online, you can repeat this example by entering 12% into the Interest Rate cell as follows:
The nominal values remain the same because the cash flows specified by the Bond indenture have not changed. What has changed, however, is the discount rate. As a result, the present value declines relative to the 8% market interest rate example. The following graph shows both the nominal and the present values over time.
Because the coupon rate is less than the market's required rate of interest, the present value of the bond increases over time from below $10,000, the face amount. Click on the Numeric button to see the undiscounted and discounted values per coupon period.
Cash Flows and Present Values
In the 8% interest rate example, the cash flows accruing to the bondholder can be viewed online by clicking on the Cash Flows option:
Graphically, this is displayed as follows:
Click on the Numeric button above to verify that the discounted and undiscounted cash flows for each Coupon Period.
As you can see, the coupon bond is made up of two types of cash flows. The first is a stream of coupon payments (or cash flows) of equal size which occurs at the end of each time period. This type of cash flow is known as an ordinary annuity or an annuity in-arrears. The second component is a one-time cash flow, equal to the face value, which occurs at the end of the bond’s life.
The cash flows from most fixed-income securities can be described by these two types of cash flows. For example, home mortgage agreements, car loans, and leases are often specified in terms of an equal series of cash flows (i.e., an annuity). If the first component of the cash flow series occurs at the beginning of the period (rather than the end of the period), then the annuity is called an annuity in-advance.
Other types of fixed-income securities are defined only in terms of the second component of a coupon bond, the face amount. This special case of a coupon bond is called a "pure discount" or "zero-coupon bond." This is a fixed-income security that makes no promised coupon payments over its life. Instead, its issuer is obliged to pay the face value of the bond at the time of its maturity. This is the most primitive form of a fixed-income security, in the sense that all other types can be viewed as some bundle of zero-coupon bonds that vary by face amount and maturity.
The U.S. Treasury issues a zero-coupon bond, called a Treasury bill. It is sold as a pure discount bond with face values ranging from $10,000 to $1,000,000. Suppose you buy a Treasury bill with a face value equal to $10,000 at a Treasury auction. Your time-line is represented in Figure 1.3.
|
|
|
Figure 1.3 Zero-Coupon Bond |
Example 1.3.3: Zero coupon bond Suppose, as in the previous example, that the time to maturity is 30 years and the market interest rate is 8%. The difference now is that there are zero-coupon payments (i.e., the Coupon Rate are set to zero). Online, the undiscounted and discounted values for this example are as follows.
You can see that, over time, the value of the zero-coupon bond increases from below the face amount because the payment of the face amount is drawing closer. This is displayed as follows:
Again click on the Numeric button to see the Undiscounted and Discounted Values per coupon per coupon payment period.
Observe that the undiscounted value remains the same over the zero-coupon bond's life and the present value increases.
Long-term zero-coupon bonds are very sensitive to shifts in interest rates. For example, at a market rate of interest equal to 8%, you can see that the present value at the beginning of Coupon Period 1 equals $993.773.
Example 1.3.4 Suppose that interest rates jumped by 75 basis points (where a basis point is 0.01 of 1%). The present value of the zero coupon bond will decline to $807.462.This can be computed online by entering the numbers, clicking OK and then clicking Numeric to see the undiscounted and discounted values.
A note on compounding frequency: in the zero coupon bond case, we have set the compounding frequency to 1. If, for example, you change it to 2, you will see the value of the bond change even though there isno change in the coupon rate, facevalue, or years to maturity. This is explained in the section Calculation of Interest later in this chapter.
The initial outlay on the timeline of any fixed-income security is its price. In Topic 1.5, The Lotto Case we will discuss what an arbitrage-free price is. Then, in Chapter 2 we discuss how it is determined. Before moving on, however, you may find it useful to review the distinction between simple and compound interest in the topic titled The Calculation of Interest.